DATA
This page talks about the data we used for each plot in our visualization.
You can check out our process book here.

The data used in this visualization comes from the experiments conducted by the ischemic research team headed by Dr.Rob S. MacLeod at the Cardiovascular Research and Training Institute located at the University of Utah. INEPT focuses specifically on the transmural plunge needle electrodes used during the ischemic experiments. During each experiment, the heart of interest is embedded with anywhere from 20 to 50 needles throughout the circumference of the ventricular myocardium. With ten electrodes along the length of each needle, there can be up to 500 electrodes placed throughout the myocardial volume, allowing for a reasonable sampling of potentials throughout the myocardium. The signals captured by the needle electrodes are referred to as electrograms (EGs), rather than electrocardiograms (ECGs), to distinguish between the signals captured on/in the heart surface and those captured on the body surface. Each electrode has an EG associated with it for every run measured throughout the experiment. Each run consists of an EG of a single heartbeat.
Each data file is stored in a csv file in our project repository.
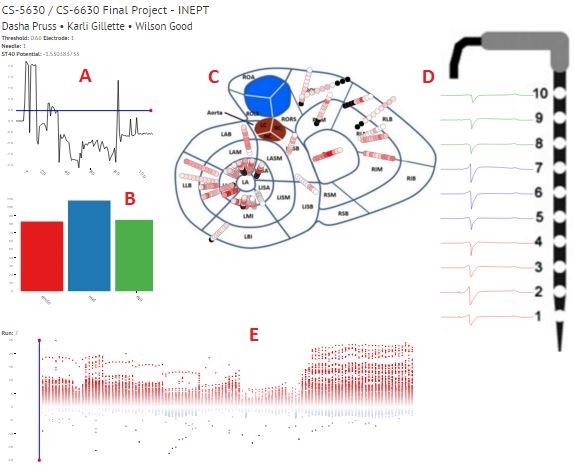
ST40 Potential plot (A)
The ST40 data contains electrode potentials (rows) and run numbers (columns). When a single row is plotted, it shows the progression of the electrode potentials for that electrode throughout the experiment.
Histogram (B)
The histogram data contains a single column containing values 1-3 referring to endo, mid, and epi. Each row in the column corresponds to an electrode number. Electrode numbers are binned in the histogram according to their depth in the heart.
Bullseye plot (C)
The bullseye data contains transformed X and Y coordinates (the spatial electrode data was originally 3D, but the Z coordinate was ignored for 2D projection) and the corresponding electrode number. Each row contains an electrode number and its location in the 2D plot.
Electogram (EG) plot (D)
The EG data contains electode potentials (rows) and time (columns). Each run corresponds to an individual EG data file. For a given needle (group of 10 electrodes) and run number, ten EGs for ten electrodes are shown vertically aligned in the electrogram plot.
Diverging scatter bin plot (E)
This plot uses the same data as the ST40 Potential Plot. Instead of showing one row at a time like the ST40 plot, this plot shows all rows at once. Each 'bin' corresponds to a run number, and the y coordinates of each point corresponds to an ST40 potential value for an electrode during a given run.
INEPT